Using Machine Learning to Redefine Business Cycles

THE HUBRIS OF HIGH LEVEL STATISTICS
A common practice of economic analysis is to divide history into periods of recessions and expansions. Business Cycles can represent years of prosperity with increasing incomes, jobs, spending and leverage. They also signal the transition to unemployment, defaulting debts, pain and loss.
Business cycles are analysed using the same top-level economic statistics that economists have looked at for over 100 years. Two consecutive quarters of negative GDP growth typically marks the start of a recession[1]. However, officially in the US the National Bureau of Economic Research (NBER) looks a bit deeper in the data to identify the exact month that recessions started or ended[2]. In practice, this method of tracking business cycles is so backwards looking that the results are of little use to investors. Professional Investors need actionable information about the state of the world at any given instant.
The complexity of the global economic machine warrants a more descriptive analysis than a simple “recession” vs “expansion” label. To fully understand the nuances of the ebbs and flows of the business cycles and shocks, we must look deeper into the data. We must model the interactions rather than distill the whole world into just a handful of statistics. This is where Astrocyte’s Breakpoint can help us explore. In this piece, it leads us to some interesting developments in the Healthcare Sector.
THE OLD WAY: ONE BUSINESS CYCLE FITS ALL
The ability to foresee the next recession has been the Holy Grail of economists and investors since before Schumpeter and Keynes. If governments could correctly forecast an upcoming recession, they could provide more jobs or social assistance, central banks could slowly lower interest rates and consumers could gently pull back on spending rather than panic when the full-fledged recession hits. Of course, investors could adjust their portfolios accordingly.
In the United States, investors and economists traditionally look to the NBER to officially signal the start and ends of recessions. The organization is notoriously conservative when it announces these dates, and in September 2010, it announced that the economy started growing in June 2009 (a 'mere' 18 months after the fact). In its announcement, the NBER referenced 5 sources across 3 categories of data that informed its decision. These were:
- Monthly GDP
- Macro Advisers historical monthly real GDP (MacroAdvisors)
- New Stock-Watson index of monthly GDP + GDI (Princton Website)
- Industrial Production, Trade and Manufacturing
- Industrial Production (Federal Reserve)
- Real manufacturing and trade sales (BEA's NIPA)
- Employment and Incomes
- Real personal income less transfers (BEA)
- Aggregate weekly hours index in total private industries (BLS)
- Payroll survey employment (BLS) We will focus on this dataset in this post
- Household survey employment (BLS)
THE CURRENT PROBLEM: NO TWO RECESSIONS ARE ALIKE
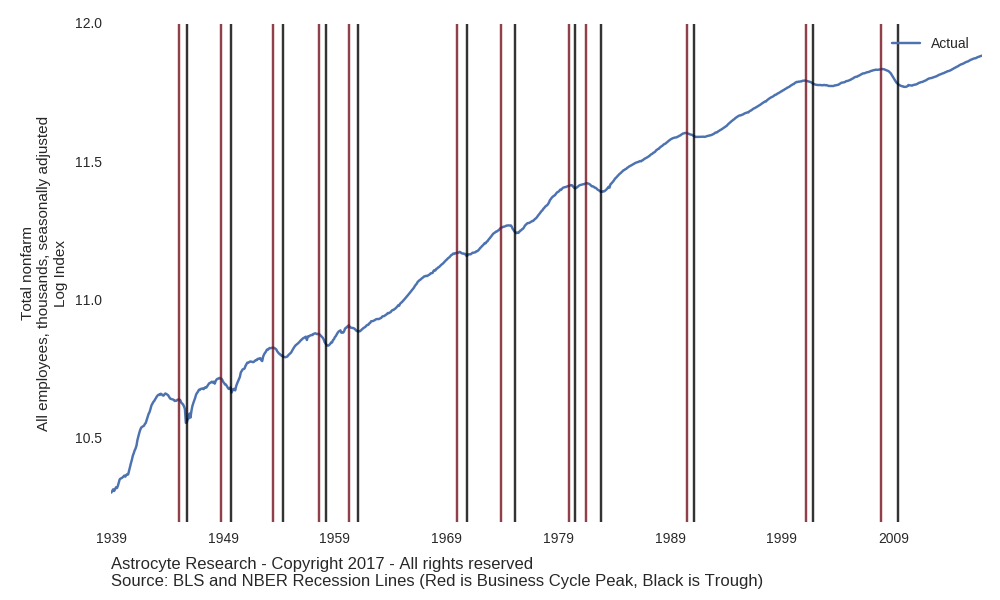
It is undeniable that the way the US economy operates today is different than it did in the 1940s; so why do we define business cycles in the same way? What about the adage that "history doesn't repeat, it rhymes?" Let’s look at how jobs recovered during each of the 12 NBER designated recoveries since 1940:
If we look a little closer and track the percent change in total employment since the start of each recession, we can see that the shapes of the recoveries have changed in recent years.
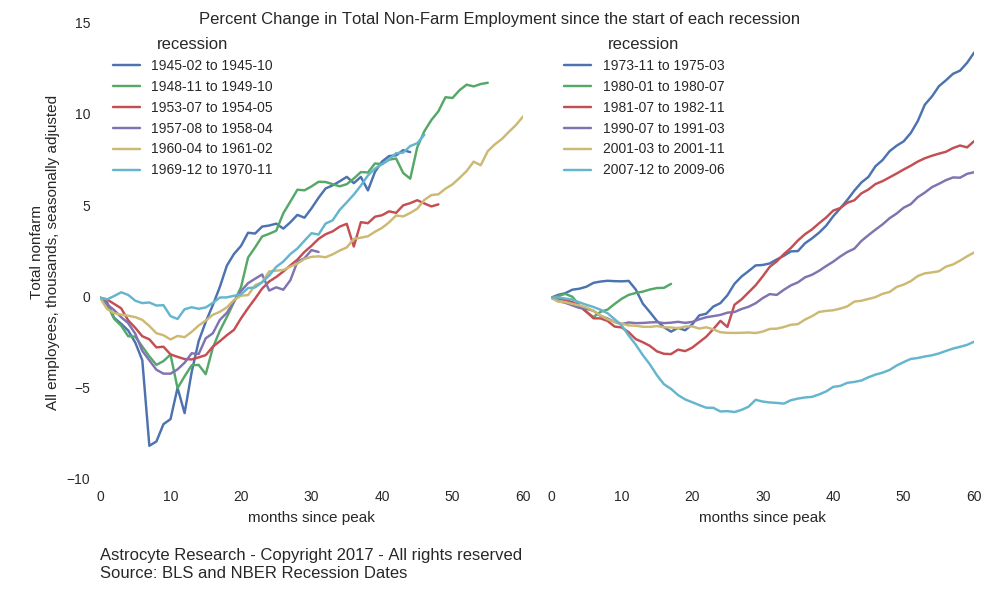
These histograms and charts tell a fascinating and compelling story about the history of the US economy, but they do not tell us much about the next recession: neither when it will start nor how long or hard it will affect the labor market.
Ultimately, designating business cycles is a slow and imprecise metric that is not much use to professional investors. Investors cannot wait years to see how the economy will evolve, and policy makers need more precise measurements to make better policy decisions. To overcome this, investors must look more deeply into the structure of the economy to better undercover the powerful undercurrents that drive the business cycles.
THE BETTER WAY: BREAKPOINTS VS BUSINESS CYCLES
The Astrocyte Research Forecasting System analyzes data by actively trying to determine if changes in employment or production are simply noise or if the structure of the economy has somehow changed. When the algorithm has found evidence that the driving factors or structure of the economy have changed, it alerts investors that there is a new Breakpoint. A Breakpoint can be the start of a recession or the end of one, but it can also signal a new trend such as the rise in health care employment after Obama Care was passed (see chart below). Economies are complex and flexible and so must be the way we track them.
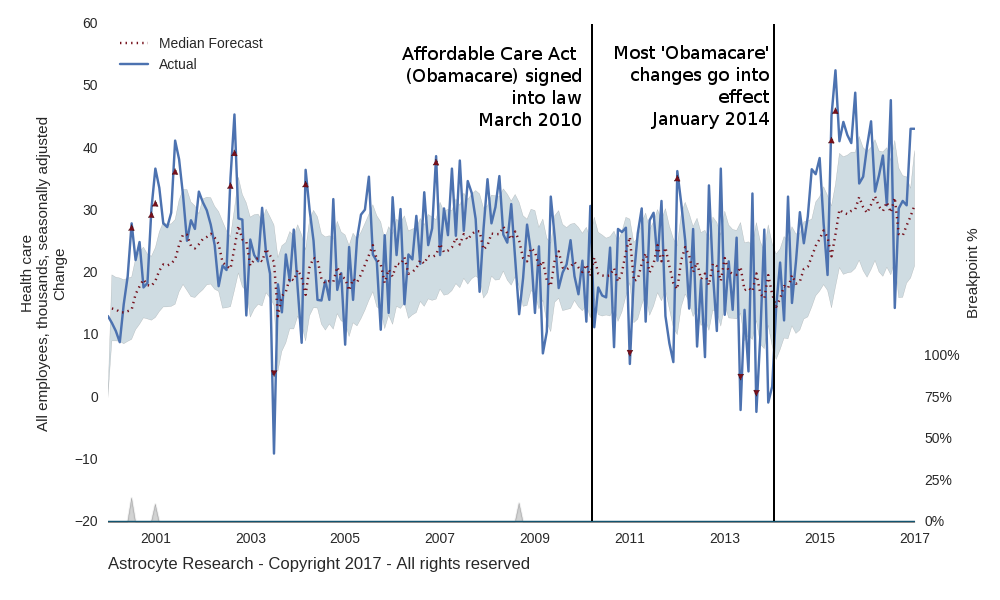
Health Care Sector growth before and after the Affordable Care Act (Obamacare) was implemented.
If we compare the NBER recession and expansion dates with the Breakpoints identified by the AI Economist this month, we can see similarities in the way they identify periods of expansion and contraction in the labor force. However, since the Astrocyte Breakpoints looks only at labor market data, we identify the slower job recovery in the 2001 recession and the breakpoints more accurately identify the start of the recovery in jobs after the last two recessions. The chart below shows the Level of US Payroll Employment since 2000 with ‘red’ and ‘blue’ lines signifying the start and end of the NBER recessions. The vertical grey lines show where the AI Economist has identified the corresponding Breakpoints.
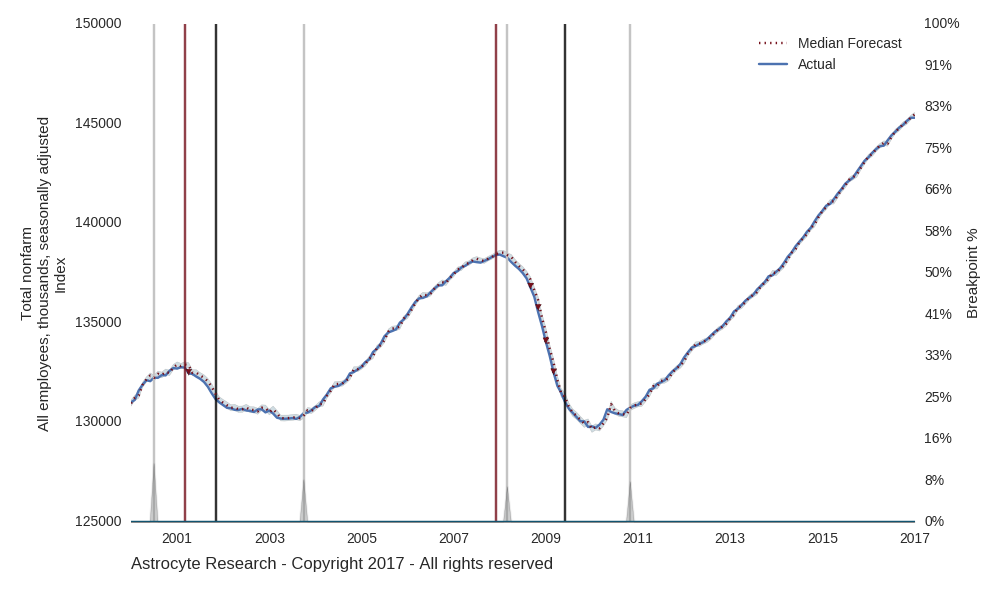
Compare the timing of the Breakpoints (grey triangles and lines) with the NBER recession bars
There are hundreds of sub-series that measure employment in sectors as broad as ‘trade, transportation, and utilities’ with 27.5 million employees in December 2016 to as narrow as ‘monetary authorities - central banks’ (18.3 thousand employees) and ‘scenic and sightseeing transportation’ (30.5 thousand employees). The Astrocyte Research Forecasting System analyses each of these series for Breakpoints and identifies key changes, a few of which are illustrated below.
EXAMPLES: BREAKPOINTS ON SUB-SECTORS OF THE US LABOR MARKET
So far we have only added a better algorithm to the existing top-level non-farm employment data. Let’s see what happens when we apply the Breakpoint Algorithm to smaller employment categories.
FINANCE SECTOR: CREDIT AND LENDING SECTOR EMPLOYMENT
Most tellingly, if we look at the Credit sector of the economy we see that the 'Non-depository credit intermediation' sector (translation: people employed to make credit card, mortgage loans or other business loans [3]) grew in the 2001 recession and fell fast in the 2007 recession.
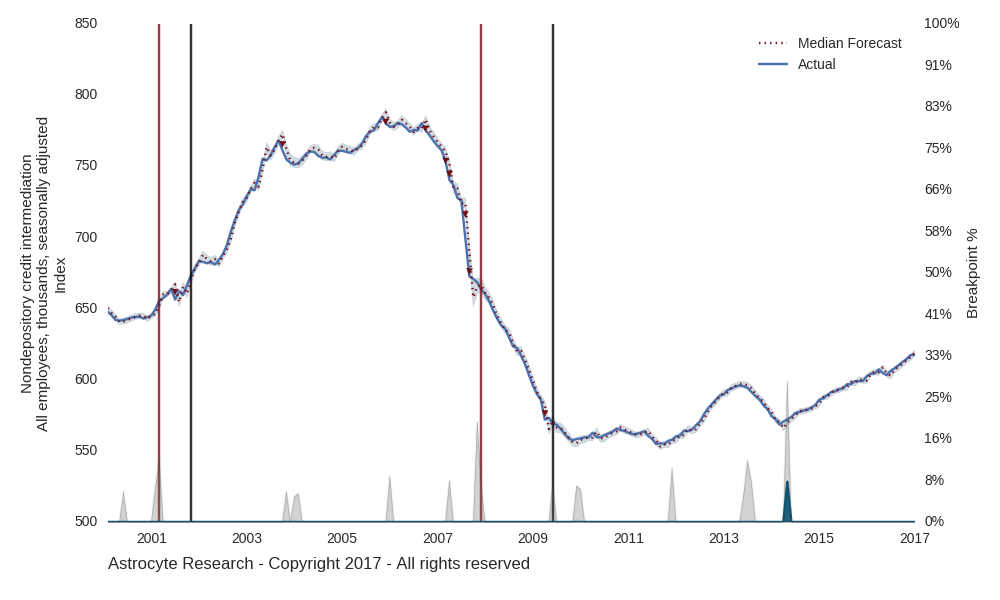
We can see here that this sector was not affected during the DotCom bust in 2001.
However the breakpoints align closely with NBER dates for the last recession.
From the perspective of the employees working in this part of the Financial Sector, there was no recession in the early 2000s. The strong growth did taper off in 2004 which was identified by the grey triangles in the lower part of the above chart. There were also some earlier indications of contraction in this industry in 2006 and 2007. We can see here that this sector has been growing strongly since mid 2014 (blue triangle).
HEALTH CARE SECTOR: HOSPITALS WERE THE FIRST TO RESPOND TO OBAMACARE
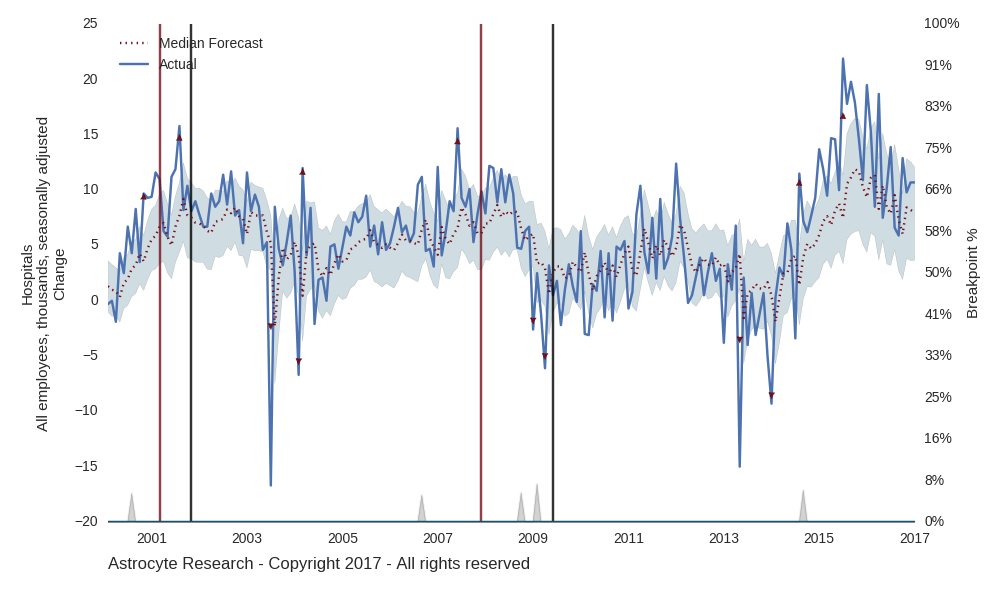
Hospitals started hiring at ~15k jobs / month after 2014. It was almost 0k / month before.
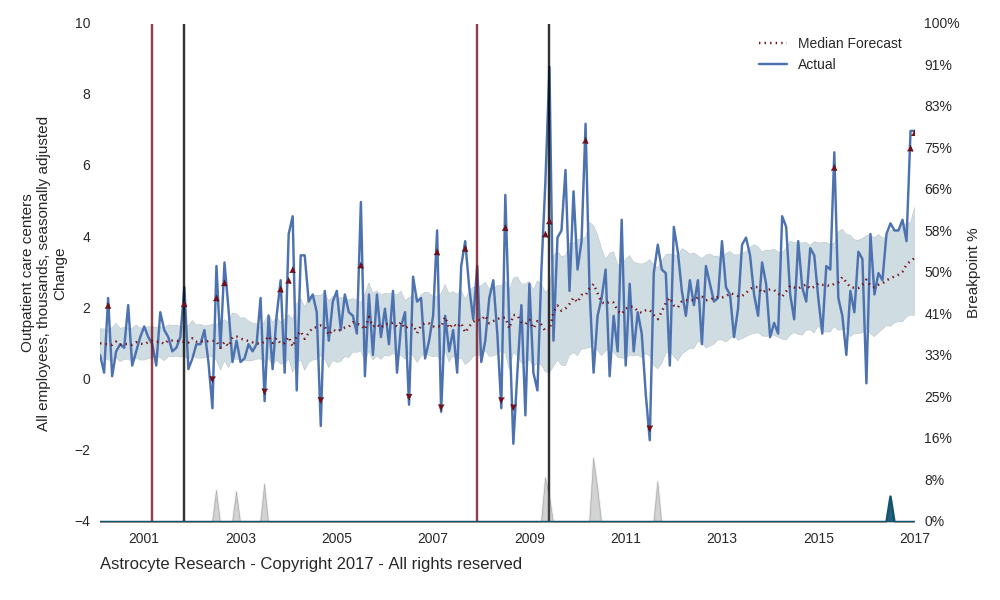
Although Hospitals were early to respond, we have seen a pick up in Ambulatory care employment. Ambulatory Care Employment includes out-patient doctors, dentists, medical facilities and labs. The outpatient care center employees have accelerating hiring in recent months.
HEALTH CARE SECTOR: OUTPATIENT CARE CENTER EMPLOYMENT
BREAKPOINTS: NEXT STEPS
There are so many interesting changes in the US economy that can happen below the surface. As shown here, certain sectors like the Credit Sector have responded differently across recessions; the Credit Sector grew in 2001 and crashed in 2007. Even the timing of responses to large policy changes within a sector can be different. We saw large hospitals begin accelerating hiring almost a year sooner than outpatient clients did so.
When we move from bulky classifications like "expansion" vs "recession" to 'Breakpoints,' we begin to tease out interesting trade ideas.